

Climate Impacts
Analyzing the future of climate.
Compare scenarios, explore EU risks, and export evidence for your reports.
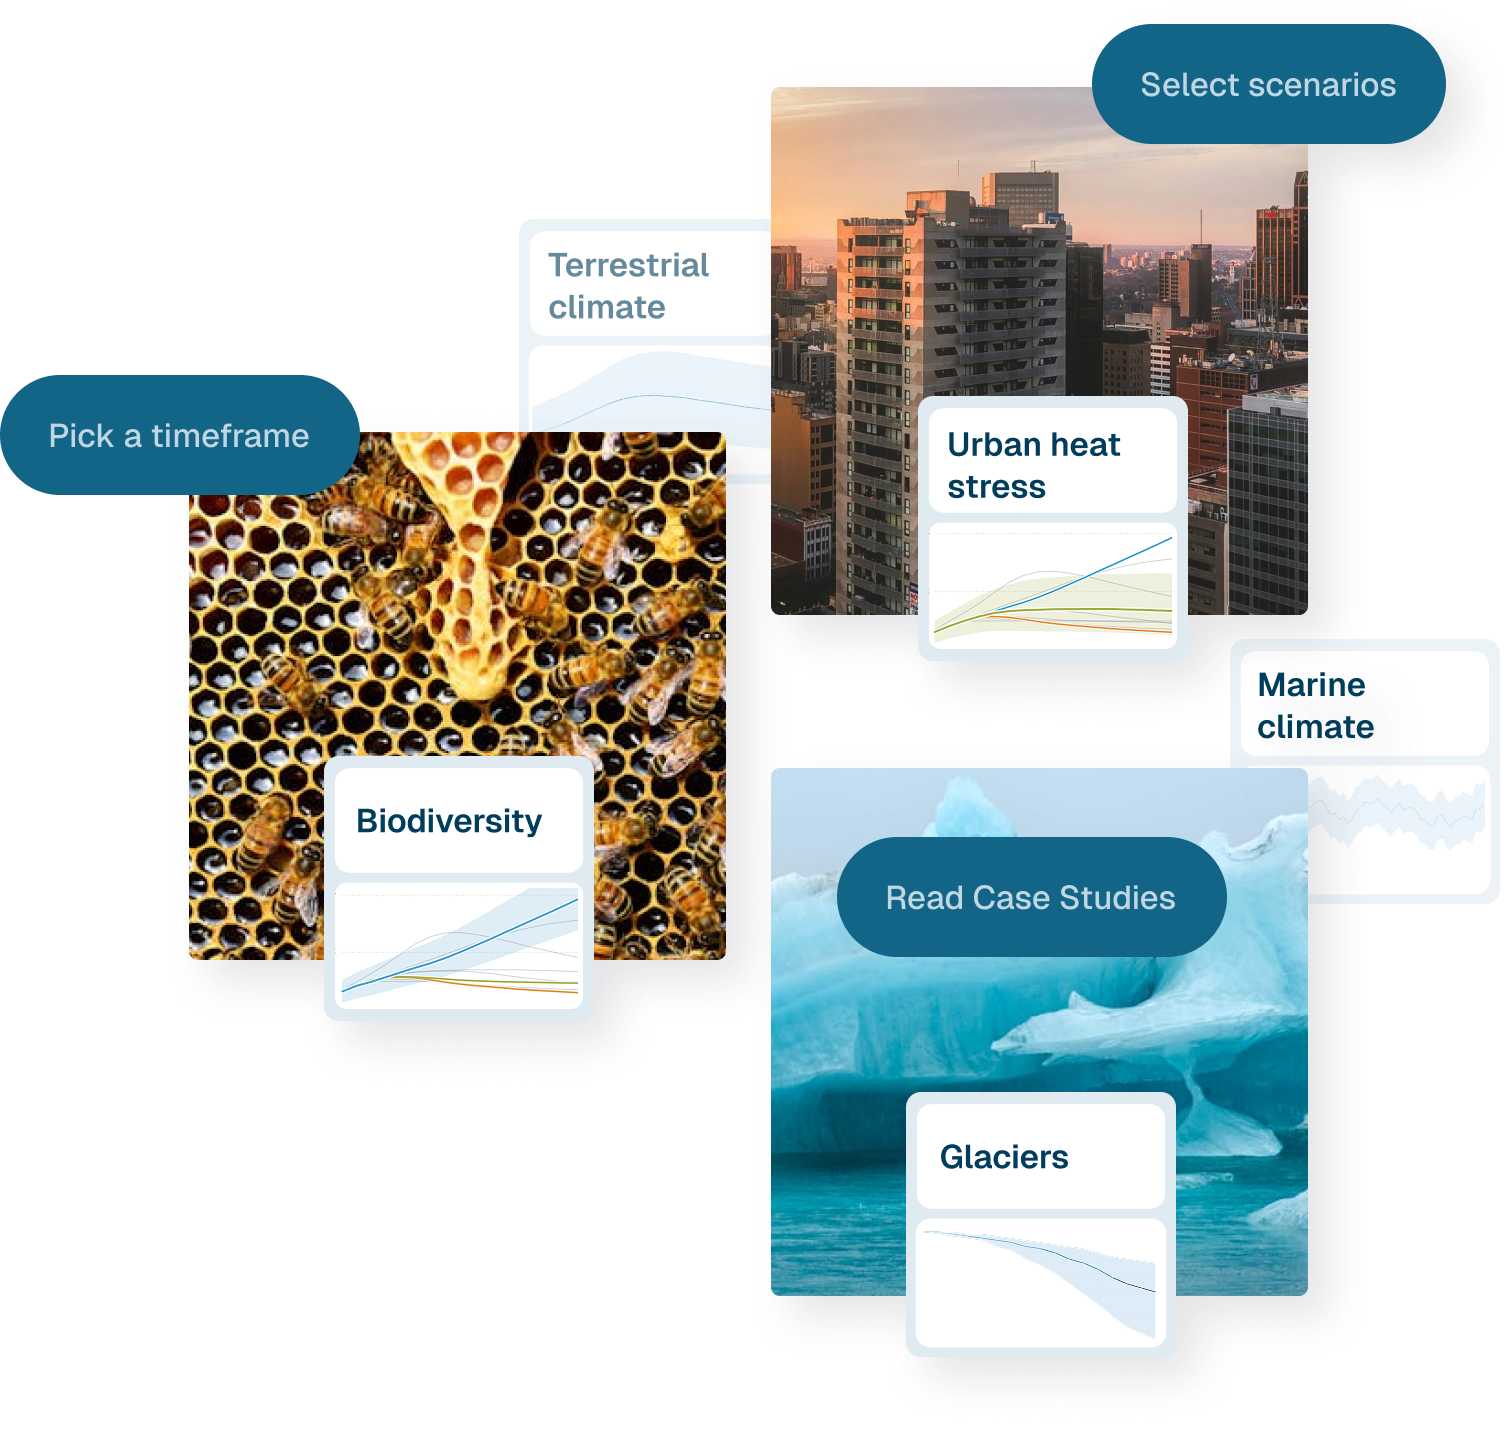
From cities to continents: assess climate risk with the Explorer
See how different levels of climate action will lead to different climate impacts for countries, cities, and more.
Go deeper with our tools for advanced analysis
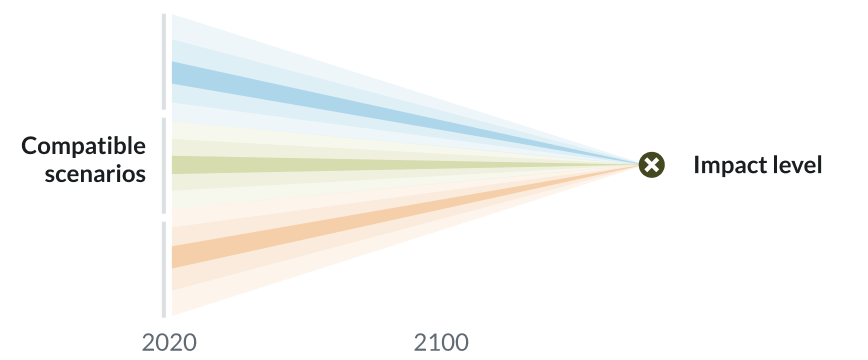
Avoiding future impacts explores which scenarios minimise the risk from certain impacts in cities and their rural surroundings.
- Project
- Provide
- Geography
- Cities
- Data source
- CMIP6
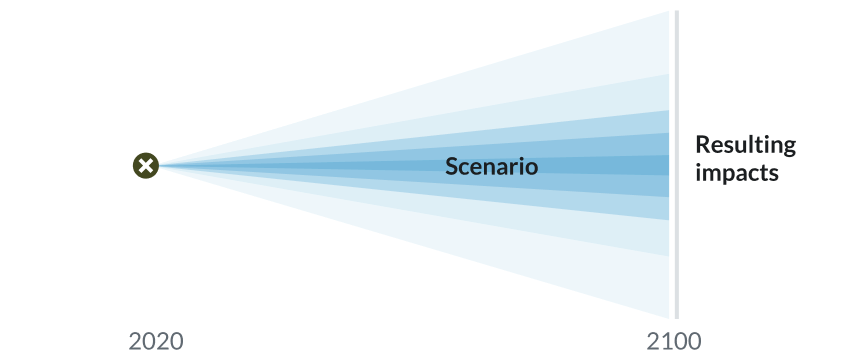
Explorer future impacts shows how different climate futures will affect the environment and people across different emission scenarios.
- Project
- Provide
- Geography
- Global
- Data source
- CMIP6
Case studies
Grab report-ready visuals and data, and learn from case studies that show how insights are used in practice. View all


Learn about the Climate Risk
Dashboard project
This platform brings together research from PROVIDE a Horizon Europe consortium developing faster ways to project climate impacts and analyse overshoot pathways. SPARCCLE, which supplies EU focused indicators, traffic-light comparisons, and data for the Scoreboard, and [New project], which will add further models, scenarios, and sectors. Together, these projects contribute the datasets, methods, and documentation that power the charts and maps you see here.
Learn moreThe Climate Risk Dashboard combines:
Projections across scales
Country- and grid-level projections under multiple scenarios show how indicators change over time and place.
Ensemble methods & uncertainty
Time-series and maps come from model ensembles, summarized with medians and confidence ranges (5th–95th percentiles).
(Un)avoidable risk
Views that estimate the likelihood of crossing chosen impact levels.